Live
Pinpoint
Advanced feedback analytics with automatic screenshot capture, click heatmaps, and real-time user session analysis.
Advanced feedback analytics with automatic screenshot capture, click heatmaps, and real-time user session analysis.
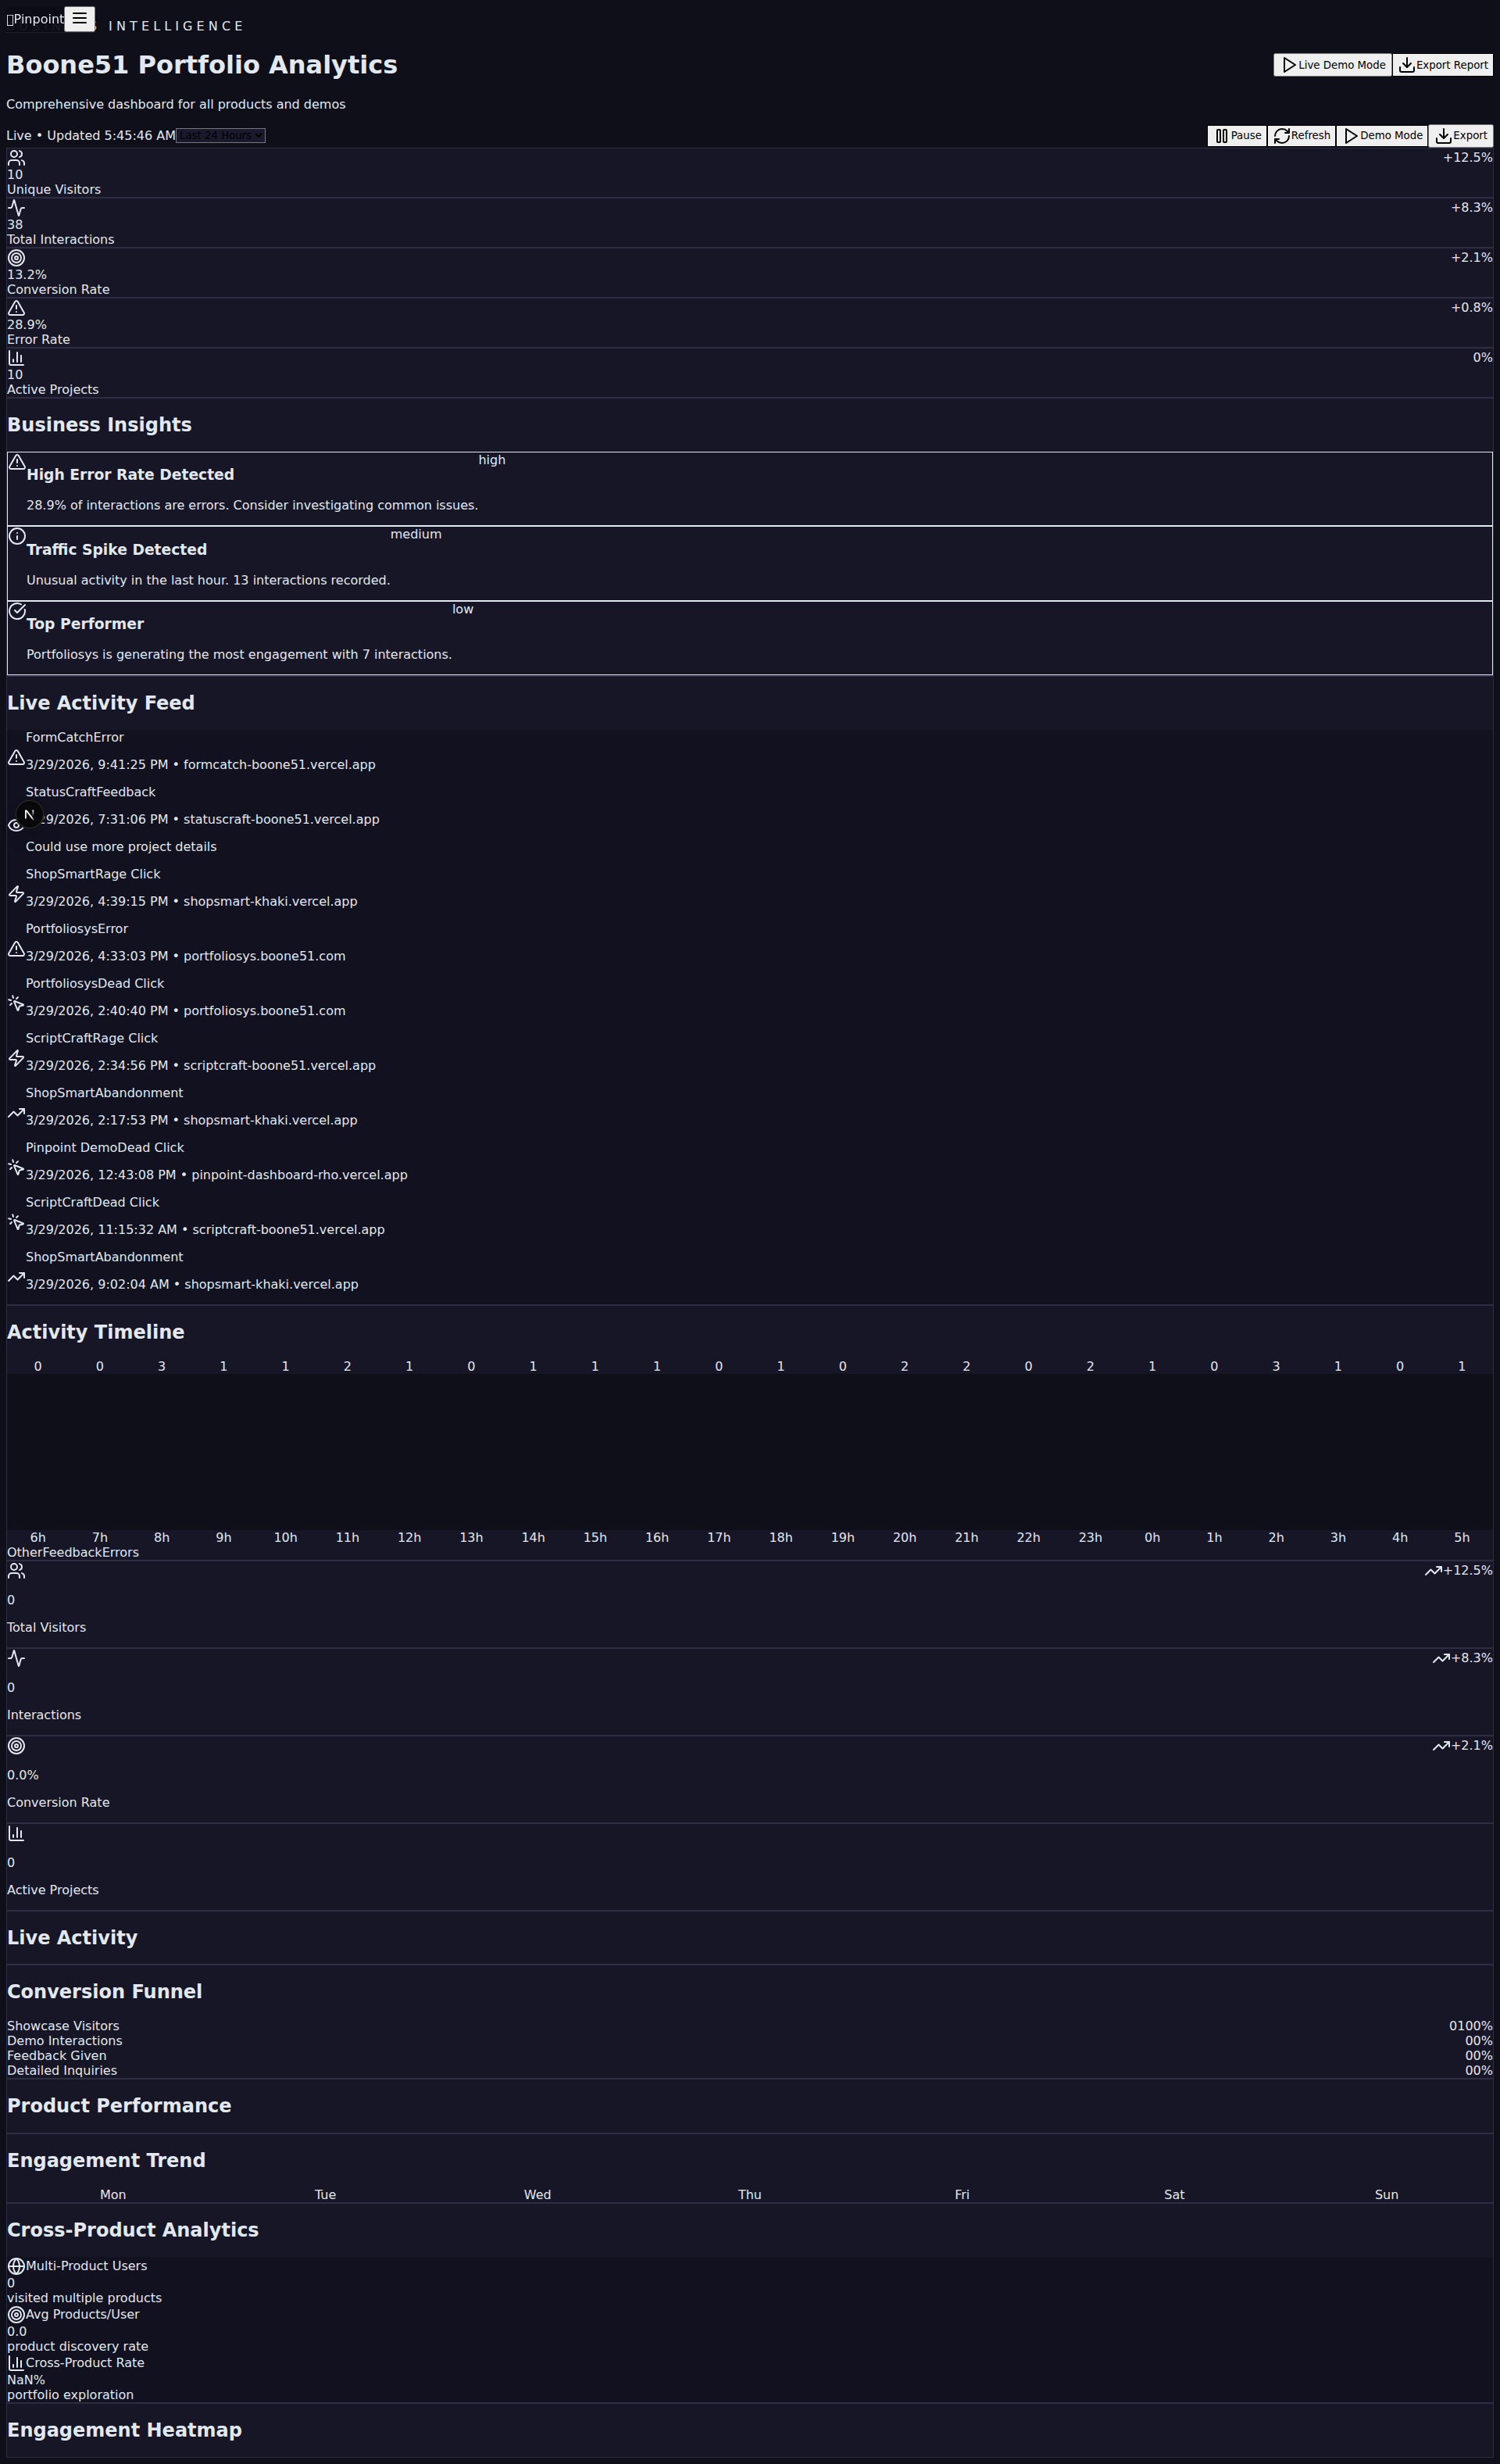
Pinpoint goes beyond traditional analytics. Instead of just numbers, you get visual proof of how users interact with your product — automatic screenshots, click patterns, and real-time feedback streams.
Captures screenshots at the moment of feedback. See exactly what the user was looking at when they reported an issue.
Visualize where users click, tap, and scroll. Identify dead zones, confusion points, and your most engaged areas.
Live analytics dashboard shows feedback as it arrives. Filter by page, sentiment, category, and time period.
Drop a lightweight widget into any site. Users submit feedback without leaving the page. No popups, no friction.
Session-level analysis reveals patterns across users. Understand common paths, drop-off points, and engagement trends.
Visual gallery of all captured feedback with screenshots. Share with your team, prioritize fixes, track resolutions.
Built for real-time performance with a lightweight client-side widget and a fast analytics backend.
Add Pinpoint to your site and get visual feedback in minutes. See the dashboard live.